Network meta-analysis and ARDS

bayesian
statistics
medicine
r
ards
Author

Nick Plummer

Published

October 9, 2025

Yesterday one of our residents presented the ROSE trial at journal club. This trial compared the use of neuromuscular blocking agents (NMBA) combined with deep sedation against no NMBAs and light sedation in patients with Acute Respiratory Distress Syndrome (ARDS).

The conclusion? They might not be beneficial (which conflicts with the findings of the classic ACURASYS trial). But there’s also confounders, such as the depth of sedation or level of PEEP, that might explain it. So who knows?

Well, one potential solution to this is a network meta-analysis. So let’s do one.

Important note: This is literally the result of a morning’s Googling to learn to use the software. I haven’t done a full systematic review, accounted for other confounders such as tidal volumes or change in practice over time, nor assessed the trials in any real depth. Though if someone is inspired by this and keen to collaborate on it then get in touch.

The trials

I’ve included the follow studies:

library(tidyverse)

( ards_data <- read_csv("ards_trials.csv") %>% 
    # Needs unique baseline for each subgroup 
    mutate(
    nmba = factor(nmba, levels = c("std_nmba", "no", "yes")),
    sedation = factor(sedation, levels = c("std_sedation", "light", "deep")),
    peep = factor(peep, levels = c("std_peep", "low", "high"))
  ) )
# A tibble: 14 × 8
   study         arm                      r     n nmba  sedation peep  mortality
   <chr>         <chr>                <dbl> <dbl> <fct> <fct>    <fct> <chr>    
 1 Gainnier 2004 nmba + deep sedatio…    13    28 yes   deep     std_… ICU      
 2 Gainnier 2004 no nmba + deep seda…    20    28 no    deep     std_… ICU      
 3 ACURASYS      nmba + deep sedatio…    56   177 yes   deep     low   90d      
 4 ACURASYS      no nmba + deep seda…    66   162 no    deep     low   90d      
 5 ROSE          nmba + deep sedatio…   213   501 yes   deep     high  Hospital 
 6 ROSE          no nmba + light sed…   216   505 no    light    high  Hospital 
 7 Villar 2006   std nmba + std seda…    17    50 std_… std_sed… high  Hospital 
 8 Villar 2006   std nmba + std seda…    25    45 std_… std_sed… low   Hospital 
 9 ALVEOLI       std nmba + std seda…    75   274 std_… std_sed… high  Hospital 
10 ALVEOLI       std nmba + std seda…    68   275 std_… std_sed… low   Hospital 
11 LOVS          std nmba + std seda…   173   475 std_… std_sed… high  Hospital 
12 LOVS          std nmba + std seda…   205   508 std_… std_sed… low   Hospital 
13 EXPRESS       std nmba + std seda…   136   385 std_… std_sed… high  Hospital 
14 EXPRESS       std nmba + std seda…   149   382 std_… std_sed… low   Hospital 
  • For each study there were r events (ICU or hospital deaths) from a sample size of n
  • Reference (baseline) levels for each component is std_xxx (ie not being assessed by the trial)

Build a network

We’ll use the multinma package to do this, as it’s a relatively polished, modern, and powerful package which plays nicely with the tidyverse.

library(multinma)
# Define the network
ards_net <- set_agd_arm(
  ards_data,
  study = study,
  trt = arm,
  r = r,
  n = n,
  # Create treatment classes from component columns
  trt_class = ards_data[, c("nmba", "sedation", "peep")]
)

print(ards_net)
A network with 7 AgD studies (arm-based).

------------------------------------------------------- AgD studies (arm-based) ---- 
 Study        
 ACURASYS     
 ALVEOLI      
 EXPRESS      
 Gainnier 2004
 LOVS         
 ROSE         
 Villar 2006  
 Treatment arms                                                     
 2: nmba + deep sedation + low peep | no nmba + deep sedation + l...
 2: std nmba + std sedation + high peep | std nmba + std sedation...
 2: std nmba + std sedation + high peep | std nmba + std sedation...
 2: nmba + deep sedation + std peep | no nmba + deep sedation  + ...
 2: std nmba + std sedation + high peep | std nmba + std sedation...
 2: nmba + deep sedation + high peep | no nmba + light sedation +...
 2: std nmba + std sedation + high peep | std nmba + std sedation...

 Outcome type: count
------------------------------------------------------------------------------------
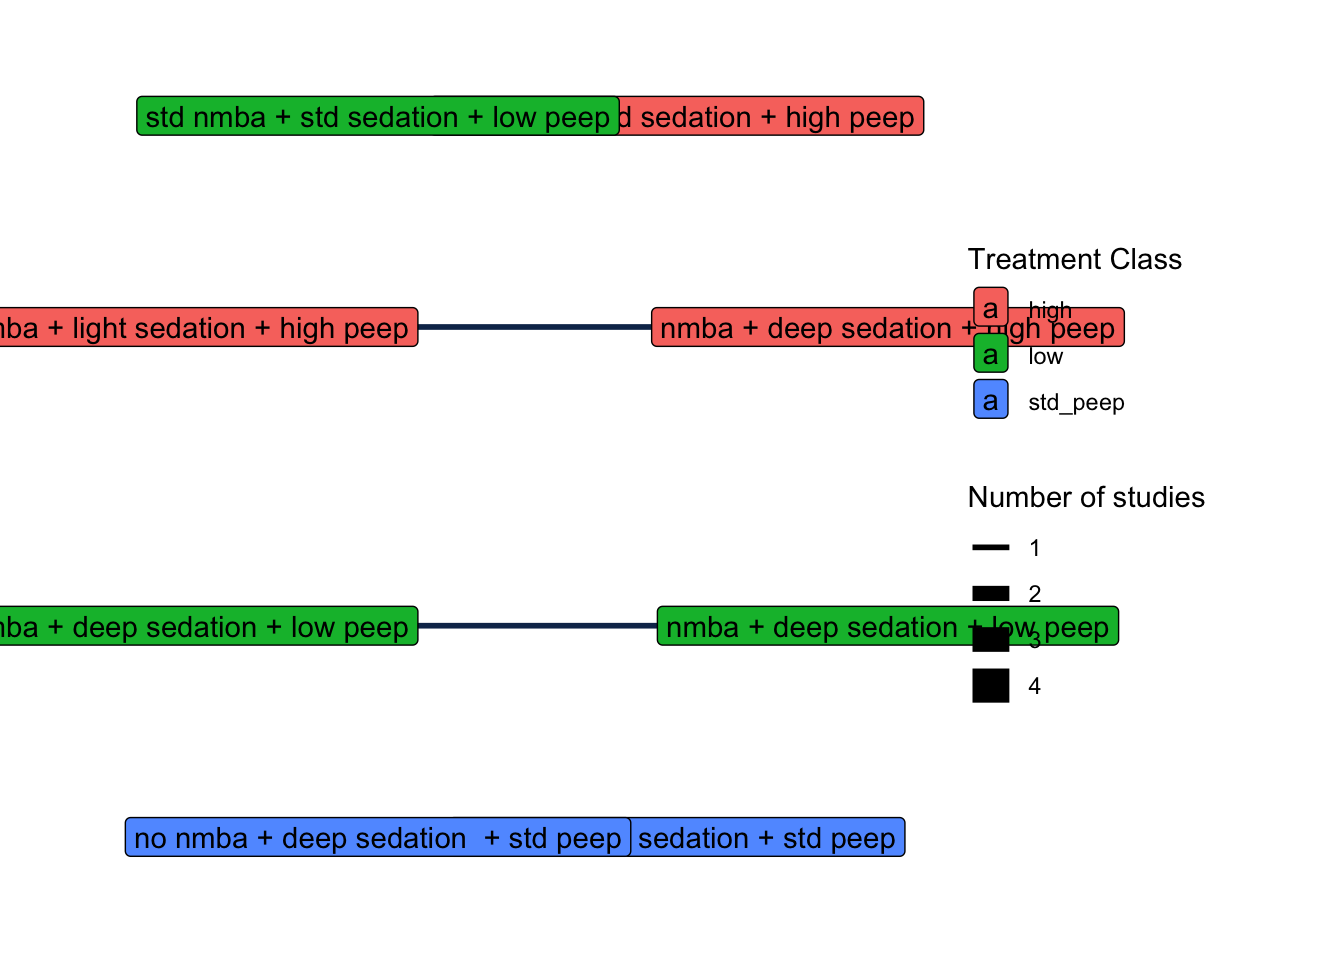
Total number of treatments: 8, in 3 classes
Total number of studies: 7
Reference treatment is: std nmba + std sedation + high peep
Network is disconnected

We have a problem here. Our network is “disconnected”. What does this mean? Lets plot it to see:

plot(ards_net, show_trt_class = TRUE)